Quite a time ago I wrote a supplement to a network flow generator called tranalyzer. In contrast to tranalyzer the script should:
- extract the same features as wireshark.
- aggregates flows based on a configurable set of features.
- use JSON as its default output.
- be compatible with UNIX pipes.
This blog post gives a brief introduction into the flow processing world then presents the script called pdml2flow. At last I will show a couple of real world applications of the said script. The target audience are people familiar with IP networking on the command line.
Terminology
Before we start I do have to introduce and define some terms.
Network flows
A network flow is a fuzzy term. Looking up network flow in wikipedia reflects this. Wikipedia quotes several RFCs123 and they all differ. But most of them share the aspect that a network flow is a set of packets having a set of attributes in common. The term emerged from the mathematical definition of a flow network. This is something routing-guys at universities 4 were looking at in order to design efficient routing algorithms. I didn’t live back then but among the 10 or 20 people capable of building such networks, the flow was likely a well defined term. Later, with more sophisticated networks in place, companies wanted to have more control over what kind of traffic they are routing and how much of it. So they started building walls of fire 5 and started shaping traffic (QoS). For this purpose a lot of proprietary mechanisms for flow control were developed in parallel, with the effect of washing out the term. In the pdml2flow context we use a slightly different and more generic definition of a flow:
A flow \(\Xi\) (xi) is the set of all frames \(f\) which are equal for a set of attributes \(A\) and are all in a certain proximity \(t\) of each other.
Other than the definitions mentioned so far, pdml2flow operates on frames \(f\) instead of packets. Frames are maps of attributes to values.
\[f : \mathbb{U} \rightarrow \{\perp\} \cup \mathbb{U}\]\(\mathbb{U}\) denotes the set of all possible Unicode strings and \(\perp\) the response iff an attribute is not defined. The set of all possible frames is called \(F\), thus \(f \in F\). Using an arrival time function \(\tau\) (tau):
\[\tau : F \rightarrow \mathbb{R}\]we can order \(F\). When we combine all these definitions 6 we can now write an algorithm in python which constructs us a certain flow around a generating frame \(f^{'}\) (f0):
def same_flow(f, xi, t, A):
  """ Returns True iff f belongs to xi in respect to t and A """
  for test in xi:
    if abs(tau(test) - tau(f)) < t and all([ test[a] == f[a] for a in A ]):
      return True
  return False

def get_flow(F, t, A, f0):
  """ Returns a set which contains all frames belonging to the flow xi(t, A, f0) """
  xi = [f0]
  while True:
    newXi = [ f for f in F if same_flow(f, xi, t, A) ]
    if len(newXi) == len(xi):
      return set(xi)
    xi = newXi
That’s quite a lot of formalism. The following diagram should give a concrete example for a three flows scenario:
 Visualization of four frames in three flows
Note:
- \(f1\) is not in the same flow as \(\{f2, f3\}\) because \(f1\) is not in proximity of one of the two others.
- \(f2\) is neither in \(\{f1\}\) nor in \(\{f2,f3\}\) because they contain different values for the attribute ‘port’
PDML - Packet Details Markup Language
PDML is a XML schema which can be used for describing packets. For in depth information please refer to the PDML-specification or the NetPDL-paper. Furthermore provides the PDML-schema as well as the NetPDL-schema a in depth implementation specification. The reason why I chose PDML as an input format is that wireshark / tshark does support the PDML format out of the box:
$ tshark -i eth0 -T pdml
The script
Download, Installation and Source Code
The newest version of the script can always be found in the Python Package Index. This means installing and updating the software using pip should be as simple as:
$ sudo pip install --upgrade pdml2flow
This will install three components system wide:
- pdml2flow: aggregates frames to flows and converts them to either JSON or XML.
- pdml2json: converts pdml frames to JSON.
- pdml2xml: converts pdml frames to XML.
The source code is hosted at GitHub and automatically built using Travis CI and Coveralls. Issues are being tracked in the pdml2flow-issue tracker.
Running it
The script reads from stdin and writes to stdout, debug messages and warnings are reported to stderr. This allows for easy integration with wireshark / tshark 7 as data generator and jq as post processor. Reading a .pcap-file is as simple as:
$ tshark -r file.pcap -T pdml | pdml2flow
or sniff live packets from a network interface:
$ tshark -i eth0 -T pdml | pdml2flow
For post processing, such as pretty printing, you can further pipe stdout to jq:
$ tshark -i eth0 -T pdml | pdml2flow | jq
Changing the behavior
pdml2flow has several command line options. I’ll give a brief overview of the most important ones.
-f: Attribute Set
This option lets you define the attributes \(A\) which define a flow. Each attribute in the set must be specified using a separate -f option. The name of the attributes should match the corresponding wireshark display filter. The wireshark project maintains an exhaustive list of display filters, but its usually easier to jump directly into wireshark and compile your attribute set there. 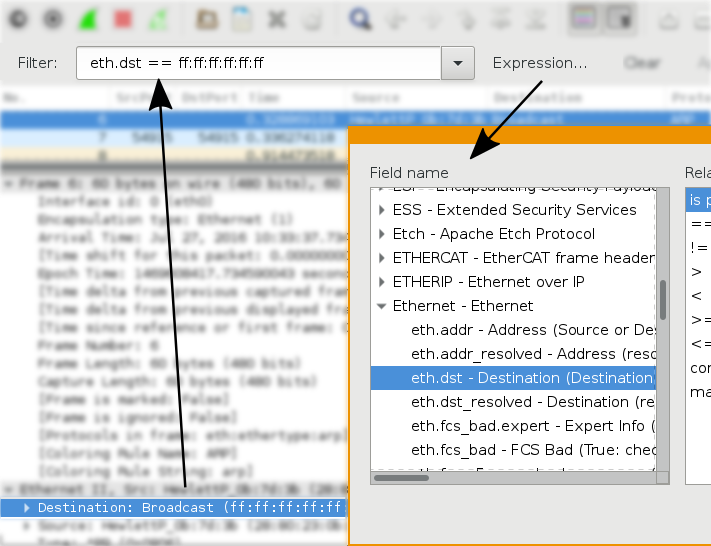 Using wireshark to find display filter names Alternatively you can use the utility pdml2json in combination with jq. The following command captures the first 100 packets from eth0 and prints out all possible display filters.
$ tshark -i eth0 -T pdml -c 100 | pdml2json | jq -s '
  add
  | [
      (keys - ["data"])[] as $key
      | {
        ($key): .[$key] | keys
      }
  ]'
Which should give you something like (incomplete):
[
  {
    "_ws": [
      "expert"
    ]
  },
  {
    "arp": [
      "dst",
      "hw",
      "opcode",
      "proto",
      "src"
    ]
  },

[...]
The next command is an example application of the -f flag. When using it you will essentially get a live view of all Ethernet connections on interface eth0:
$ tshark -i eth0 -T pdml | pdml2flow -c -t 10 -f eth.dst -f eth.src | jq '.eth.addr.raw'
-t: Flow Buffer Time
This option lets you define the proximity \(t\). Note that in the pdml2flow context the arrival time function \(\tau\) will always yield the value of the field frame.time_epoch.raw. Frames not having a frame.time_epoch.raw will be discarded. In the example above we set -t 10 because most Ethernet flows will have a lot of assigned frames, thus will never terminate if \(t\) is too big.
-c: Compress
This option will compress the output. Normally all attribute values will be extracted from a frame \(f\) and appended in order (according to \(\tau\)) to the flow \(\Xi\). In real world applications however, some attribute values are recurring and not interesting. The previous example without the -c option will print something like:
[
  "9a:89:d9:ee:c8:1e",
  "00:11:32:3d:82:a5"
]
[
  "ff:ff:ff:ff:ff:ff",
  "8c:96:1f:e7:4d:72",
  "ff:ff:ff:ff:ff:ff",
  "8c:96:1f:e7:4d:72",
  "ff:ff:ff:ff:ff:ff",
  "8c:96:1f:e7:4d:72",
  "ff:ff:ff:ff:ff:ff",
  "8c:96:1f:e7:4d:72",
  "ff:ff:ff:ff:ff:ff",
  "8c:96:1f:e7:4d:72",
  "ff:ff:ff:ff:ff:ff",
  "8c:96:1f:e7:4d:72"
]
[
  "ff:ff:ff:ff:ff:ff",
  "c9:a2:ab:8c:90:36",
  "ff:ff:ff:ff:ff:ff",
  "c9:a2:ab:8c:90:36",
  "ff:ff:ff:ff:ff:ff",
  "c9:a2:ab:8c:90:36",
  "ff:ff:ff:ff:ff:ff"
]
With the -c option present this will be compressed to:
[
  "9a:89:d9:ee:c8:1e",
  "00:11:32:3d:82:a5"
]
[
  "ff:ff:ff:ff:ff:ff",
  "8c:96:1f:e7:4d:72"
]
[
  "ff:ff:ff:ff:ff:ff",
  "c9:a2:ab:8c:90:36"
]
Note that compression will not preserve the order of the values. Which means the following output could also have been possible:
[
  "00:11:32:3d:82:a5",
  "9a:89:d9:ee:c8:1e"
]
[
  "ff:ff:ff:ff:ff:ff",
  "8c:96:1f:e7:4d:72"
]
[
  "c9:a2:ab:8c:90:36",
  "ff:ff:ff:ff:ff:ff"
]
Revisiting and expanding the example above, we get a command which will print a live view of all Ethernet connections with a count of seen IP addresses within the flow.
$ tshark -i eth0 -T pdml | pdml2flow -t 10 -f eth.dst -f eth.src | jq '
  def cunique: group_by(.)? | map( { (.[0]) : (. | length)} );
  {
    ethSrc: (.eth.src.raw | unique)[0],
    ethDst: (.eth.dst.raw | unique)[0],
    ipSrc: (.ip.src.raw | cunique)[0],
    ipDst: (.ip.dst.raw | cunique)[0]
  }'
which will print something like:
{
  "ethSrc": "c9:a2:ab:8c:90:36",
  "ethDst": "ff:ff:ff:ff:ff:ff",
  "ipSrc": {
    "10.1.2.123": 1
  },
  "ipDst": {
    "10.2.3.4": 1
  }
}
{
  "ethSrc": "00:11:32:3d:82:a5",
  "ethDst": "9a:89:d9:ee:c8:1e",
  "ipSrc": {
    "10.3.2.1": 1
  },
  "ipDst": {
    "239.255.255.250": 1
  }
}
Example usage
The following section should list a couple of example commands. With the goal of inspiring new users to build their own set up. If you built your own commands already, don’t hesitate to share them in the comment section!
- Map HTTP Uris to IP addresses requesting them.
$ tshark -i eth0 -T pdml | pdml2flow -f 'http.host' -f 'http.request.uri' | jq '
  def cunique: group_by(.)? | map( { (.[0]) : (. | length)} );
  {
    uri: (
      "http://"
      + .http.host.raw[0]
      + "/"
      + .http.request.uri.raw[0]
    ),
    ipSrc: (
      .ip.src.raw | cunique
    )
  }'
- Monitor TLS / SSL handshakes.
$ tshark -i eth0 -T pdml | pdml2flow -s | jq '
if
  .ssl.handshake.type
then
  {
    ipSrc: ( .ip.src.raw | unique? )[],
    ipDst: ( .ip.dst.raw | unique? )[],
    sslHandshakeMessages: ( .ssl.handshake.type.show )
  }
else
  empty
end'
- Mean and standard deviation of TCP payloads lengths.
$ tshark -i eth0 -T pdml | pdml2flow | jq '
def meanStdDef(name):
try (
  (
  # calculate mean
    (
      reduce .[] as $item (
        0;
        . + $item
      )
    )
    /
    (. | length)
  ) as $mean
  | [
    $mean,
  (
  # calculate standard deviation
    (
      (
        reduce .[] as $item2 (
          0;
          . + (($item2 - $mean) | pow(.;2))
        )
      )
      /
      (. | length)
    ) | sqrt
  )
  ]
) catch ([-1, -1])
| { (name + "Mean"): (.[0]), (name + "StdDev"): (.[1]) };

.tcp.len.raw | meanStdDef("tcpLen")'
Disclaimer
- pdml2flow was designed to be flexible. Speed was never a requirement. If you want to do high bandwidth real time frame processing use specialized software such as tranalyzer, bro or DPDK.
- pdml2flow is licensed under the Apache License Version 2.0